Some graphs require you to install a specific packages.
New packages can be installed by command (install.packages()) and then you can download a specific package from your favorite mirror site.
In order to use a package function, you have to load package library.
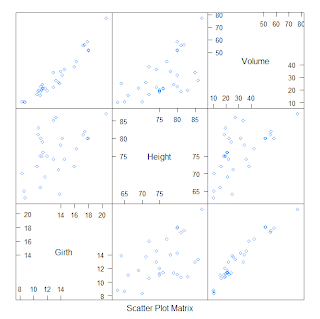
(1) Scatter plot matrix
First graph I'd like to introduce is scatter plot matrix.
I'll show you two different ways to generate graph.
Scatter plot matrix is useful if your data has a multi variable to compare each other.
* trees data will be used for further test.
> plot(trees)
I think two graph is quite similar, bottom one needs to install another package.
(2) Visual Graph
If you need to visualize the data distribution for your boss or manager.
I think this graph is awesome in terms of visuality.
You can apply different kinds of color to maximize visuality.
If you need to visualize the data distribution for your boss or manager.
I think this graph is awesome in terms of visuality.
You can apply different kinds of color to maximize visuality.
smoothScatter(trees$Height,trees$Volume)
(3) 3D Graph
3 dimensional graph is also supported.
As you can see below, we still use same data (trees) but diverse graph can be
generated for your own purpose.
> scatterplot3d(trees, type="b", highlight.3d=TRUE)


댓글 없음:
댓글 쓰기