- Discrete distribution
- Continuous distribution
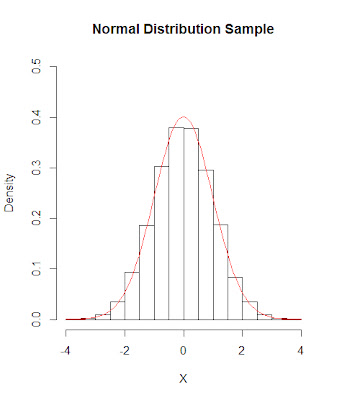
Normal distribution is very popular distribution which is a continuous probability distribution defined by below formula.
A normal distribution has some features.
- Normal distribution is symmetric with respect to mean value. (upper graph mean =0)
- Probability is measured over intervals, not single point (Calculated by integral)
- Total integral of the probability is 1
= 1
- Good normal distribution is proportion to sample size. (check out the kurtosis,skewness)
As I mentions, normal distribution is continuous density distribution,
we need a special table to calculate the probabilithy or x-axes variable, we called this
"Z score table" check out the z score through your internet.
Fortunately, R provides a useful function to calculate z score such as
pnorm(x, mean, sd) => gives the probability of getting a value from the cumulative probability function
qnorm(p, mean, sd) => gives the value that is the Pth percentile from cumulative probability function.
Let's take a value from our assumption.
1) Get a probability of x-axis 2 from the normal distribution that their mean is 0 and standard deviation is 2.
2) Get a probability of x-axis 4 from the normal distribution that their mean is 0 and standard deviation is 2.
3) Get a x-axis value that is the 0.8413447% from the normal distribution that their mean is 0 and standard deviation is 2.
4) Get a x-axis value that is the 0.9772499% from the normal distribution that their mean is 0 and standard deviation is 2.
> pnorm(2, 0 ,2)
[1] 0.8413447
> pnorm(4, 0 ,2)
[1] 0.9772499
> qnorm(0.8413447, 0,2)
[1] 2
> qnorm(0.9772499, 0,2)
[1] 4.000001
Are you aware that upper 2 questions are related with bottom 2 question ?


댓글 없음:
댓글 쓰기