2012년 12월 28일 금요일

File data handling - No7

Last few posts, I spent most of time explaining how to generate data and how to manipulate data by using different functions such as matrix, data frame or Vector.
However, In reality, we get a raw data from database or files. 

In this post, I will show you one of the the simplest ways to handle raw data file.
and I will cover database connection later.
I think, most of people are MS excel user. 
Probably, you also have various raw data which come from diverse data source.
Looked at from that point of view, collecting meaningful raw data might be the beginning of your data analysis.  

In this lesson, I will assume that we have a meaningful excel data requires further data analysis.


2012년 12월 22일 토요일

[R Study(Data Frame - No6 ]

It's been a long time since I posted. Actually I tried to make at least 2 new posts every week. I thought that was easy, however I think I am getting lazy.

Anyway, today I'll talk about "DATA Frame"
Data Frame is a columnar organization of data which is composed of named vectors, matrix or other data frame. (In fact, I don't mention other data objects that I didn't mention)


Let's make a  DATA Frame with different ways


> Student <- c("Minseo","DK","KyungHwa")
> Math_Score <- c(80,90,60)
> Eng_Score  <- c(80,60,70)
> Test_Result <- cbind(Student,Math_Score,Eng_Score)


[ Type A ]

> Test_Result_DF <- data.frame(Student, Math_Score, Eng_Score)
> Test_Result_DF
   Student Math_Score Eng_Score
1   Minseo           80        80
2       DK              90        60
3 KyungHwa         60        70

[ Type B ]


> Test_Result_DF2 = as.data.frame(Test_Result)
> Test_Result_DF2
   Student Math_Score Eng_Score
1   Minseo         80        80
2       DK         90        60
3 KyungHwa         60        70


As you can see, two different ways brought the same result.

Once you get a data frame, you can get a diverse results,  if you want to get a result that mathematics score is above 70


> Test_Result_DF[Math_Score>70,]
  Student Math_Score Eng_Score
1  Minseo         80        80
2      DK           90        60

Furthermore, you can  choose the column.

> Test_Result_DF[Math_Score>70,1]
[1] Minseo DK  
Levels: DK KyungHwa Minseo
> Test_Result_DF[Math_Score>70,c(1,2)]
  Student Math_Score
1  Minseo         80
2      DK           90
> Test_Result_DF[Math_Score>70,c(1,2,3)]
  Student Math_Score Eng_Score
1  Minseo         80        80
2      DK           90        60


I already said, data frame is a columnar organization of data which is composed of named vectors, matrix or other data frame. Therefore you can add data frame into another data frame.


> data.frame(Student, Math_Score2=Math_Score, Eng_Score2=Eng_Score)
   Student Math_Score2 Eng_Score2
1   Minseo          80         80
2       DK          90         60
3 KyungHwa          60         70
> Test_Result_DF3 <- data.frame(Student, Math_Score2=Math_Score, Eng_Score2=Eng_Score)
> merge(Test_Result_DF, Test_Result_DF3)
   Student Math_Score Eng_Score Math_Score2 Eng_Score2
1       DK         90        60          90         60
2 KyungHwa         60        70          60         70
3   Minseo         80        80          80         80
>


Data frame also gives useful functions.


  •  row control


> Test_Result_DF[1,]
  Student Math_Score Eng_Score
1  Minseo         80        80
> Test_Result_DF[2,]
  Student Math_Score Eng_Score
2      DK         90        60


  •  column control


> Test_Result_DF[2,2]
[1] 90
> Test_Result_DF[2,3]
[1] 60
> Test_Result_DF[,3]
[1] 80 60 70


  •  row count control


head (Test_Result_DF, 2)
  Student Math_Score Eng_Score
1  Minseo         80        80
2      DK           90        60


I think Data Frame is very useful.

See you next time.


2012년 12월 14일 금요일

[R Study(Matrix - No5 ]

Today,  I am going to introduce a matrix. In practical terms, I am sure this lesson will be helpful in the real word.

We learned new concept a "Vector" in a previous chapter, but in reality, we handle more complex data set, and variable. "Matrix" is one of the useful data set we can make.

I'll show you how to make a simple matrix.

First, I can make a matrix using several vectors.


> Pencil <- c(1,2,3,4,5)
> Computer <- c(10,20,30,40,50)
> Tree <- c(100,200,300,400,500)
> Export_Item  <- cbind(Pencil,Computer, Tree)
> Export_Item
     Pencil Computer Tree
[1,]      1       10  100
[2,]      2       20  200
[3,]      3       30  300
[4,]      4      40  400
[5,]      5       50  500


2012년 12월 9일 일요일

[R Study(Vector - No4 ]

Today I am going to introduce one of the important concepts of R , the Vector

Before taking up to the main subject, I have to say that, R is also programming language which has diverse statistic functions. As other languages did, R code has a variable and assignment grammar. 
I think universal grammar of assignment is "=" 
However R provide another assignment expression "<-" 

> I = 1
> I = I+2
> I
[1] 3
> I <- 1
> I = I+4
> I
[1] 5


2012년 12월 7일 금요일

Simple arithmetic operation - No3


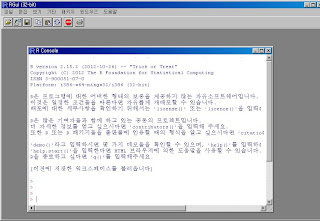
Once you'v installed R s/w successfully, main console screen is displayed by clicking the R icon on your wallpaper.

[ Main console of R]
If you encounter any problems to install R program or have no idea how to install R s/w, just read my previous post.

> Probably you are still clumsy to operate it
   R provide useful function "help"
 
   help {function}
   or
    ? {function}

   automatically trigger new window and display manual of requested function


I like this proverb, "A journey of a thousand miles must begin with the first step"
Today I am going to show you a basic arithmetic, and It might  be looks easy,
But everything has its seed.


2012년 12월 6일 목요일

How to download R program - No2


This section will cover  how to download / install R s/w
As I mentioned previous section, R is free software you can download below URL
In addition, You can get a lot of information such as packages, manuals etc


http://www.r-project.org/

1) First you can click the above URL
    Then you can see the "download R" on the middle, then click it

2) Next, select a appropriate mirror site and then choose a proper operating system(OS)
    As you can see below, R provide 3 main catagories (LINUX/MAX/WINDOW)


2012년 12월 2일 일요일

Introduction - No1

Hi, My name is DK Kim from Seoul Korea.
Now, I am working at the SK C&C one of the biggest IT companies in South Korea.

Thanks to the popularity of big data, the popularity of R language is going up alone with
the data scientist role.

I am also one of them who are interested in the open source based R language. Actually,
 My interest had started from the Big data trend.

As everybody knows, the R is free software.
Everybody can download the R software from CRAN(Comprehensive R Archive Network) in the web homepage.
Further, If you will become a qualified level, then you might contribute R project someday.

I think, one of the main reasons that many people use R software might be an analytic purpose.
That's why, statistics background is necessary to become a R user.

Even though, I go along with this idea,I think anyone can also use R as an informative tool with a basic knowledge.

Because I studied computer science rather than statistics,
I've been reading many articles and video to understand fundamental principle of R function.

There are many useful website that introduce a R language or statistics.
 However, most of them are very difficult to understand without statistical knowledge.

I'll try to make a series of R-study post that is targeting for beginner who are not major in mathematics.
Furthermore, I 'll try to show you how to analyze your real business data  with R program.

Are you ready to study R language?
Just follow me we are going a have a really good experience.
I bet ~